
NGO Monitoring and Evaluation Template: What It Must Hold
Key takeaways
- A missing value is not a zero: an indicator with nothing reported for the period should read NOT ASSESSED, because a zero tells a board a programme failed when nobody reported.
- Judge each indicator by its own direction; a lower-is-better indicator such as dropout or waiting time reads upside down if you simply divide actual by target.
- Separate what you delivered, what changed, and what your programme can be said to have caused, and let a report show NOT READY with its reason rather than publishing round numbers on unverified evidence.
In this guide 9 sections
- Start with the definition, not the number
- Indicators come last in the build, not first
- A missing value is not a zero
- A number counts only once its evidence has been checked
- Say exactly what the evidence supports
- Let the report refuse to be ready
- Review by exception, every week
- Tools that help
- Where to start
Most M&E templates are a table of indicators with a column for target and a column for actual. They work for about two quarters. Then a figure arrives that nobody can source, an indicator reads 0% because the field officer was on leave, and a board paper goes out with a red cell against a programme that was doing fine.
The templates that survive longer are not more complicated. They hold a few things the simple table leaves out: a definition per indicator, a direction, a way to say nothing was reported, and a link between a number and the evidence behind it. This guide sets out what belongs in an M&E template for an NGO, in the order the information has to exist.
Start with the definition, not the number
An indicator is not a sentence. Before any value is entered, each one needs a unit, a formula if it is a ratio, a baseline with its date, a target with a date, a data source, a collection frequency, the person responsible, and the disaggregation you intend to report. Teams that skip this collect data for a year and then discover two field offices counted beneficiaries differently.
Percentages deserve particular care. A percentage without a written numerator and denominator cannot be aggregated, compared between sites, or defended to an evaluator, and it is the most common defect in an indicator list.
The Logic Model & Logframe System scores each indicator 0 to 100 for design completeness and flags four conditions as critical blockers: no linked result, no unit, a target without a date, and a percentage without a numerator and denominator. It also checks the results chain itself for orphans, invalid parent levels and outcomes with no outputs beneath them, which catches the structural faults before any data collection starts.
Indicators come last in the build, not first
The sequence that produces a defensible framework runs backwards from the one most teams use under deadline pressure. Context and stakeholders first, then evidence, then problem analysis, then the theory of change, and only then the matrix. Indicators are last, because an indicator measures a result, and the result has to exist before anything can measure it.
Keeping assumptions, risks, preconditions and your own management actions in separate columns is the other half of the discipline. Collapsing them into one risks list is what makes an adaptation review impossible two years later, when somebody asks which assumption failed.
The Logic Model & Logframe System builds a US-style logic model and an EU-style logframe from one set of records, with a donor terminology setting that changes the labels without changing your IDs. It ships as an Excel Essential edition of 14 sheets for small teams and first drafts, and a Professional edition of 28 sheets for multi-outcome, multi-partner or institutional-donor work, each blank and as a completed sample. It stops at a structured handoff: it is not a tracker of actual results, which is the next template along.
A missing value is not a zero
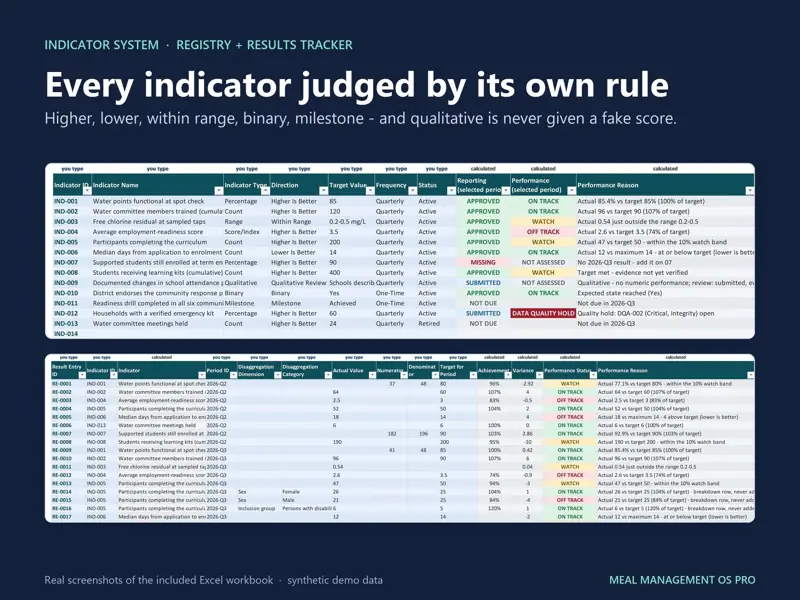
This single rule removes more false alarms from M&E reporting than anything else. When an indicator has no value for the period, the cell should read NOT ASSESSED and generate a chasing task. A zero says the programme delivered nothing, and a board that sees enough unexplained zeros stops reading the dashboard at all.
The matching rule is direction. Dividing actual by target only works for indicators where more is better. A lower-is-better indicator — dropout, waiting time, stockouts, case backlog — reads upside down under that formula, and an indicator that is a range, a yes or no, or a milestone has no meaningful percentage at all. Record the direction and type next to each indicator and let the achievement calculation follow it.
The Monitoring & Evaluation (MEAL) System applies both rules across a synthetic demo portfolio of 4 projects and 13 indicators. An indicator with no value for the period shows NOT ASSESSED rather than 0%, and each result carries On Track, Watch or Off Track with a written reason rather than a colour alone.
A number counts only once its evidence has been checked
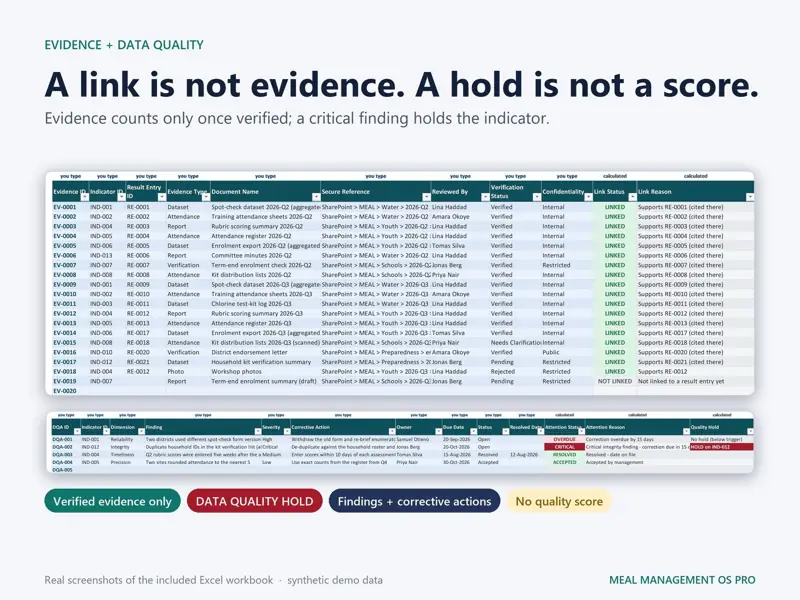
The gap between a figure in a spreadsheet and a figure somebody can stand behind is a verification step, and it is almost always missing from a template. The register that closes it is simple: for each reported result, what the evidence is, where it lives, who verified it, and when.
Data quality problems need a route that stops the number rather than annotating it. If a critical data-quality finding is open against an indicator, the honest state is a hold, not a footnote under a published figure. The MEAL system puts an indicator with an open critical finding on DATA QUALITY HOLD and treats a result as evidence-ready only after a team member has verified the linked evidence. Its dashboard in the demo reads 91% reporting complete with 3 results still awaiting evidence and 2 open data-quality actions, which is a far more useful summary than a single completion percentage.
Say exactly what the evidence supports
Funders ask what changed, and a rising outcome number is easy to present as proof that your programme caused it. Evaluators keep the claims separate, and an M&E template should carry the label with the number.
| Claim | What it means | What it needs |
|---|---|---|
| Output verified | You delivered what you said | Evidence of delivery, checked |
| Outcome observed | The measured change happened | A baseline and a comparable measure |
| Contribution supported | Your programme was one of the causes | Evidence linking activity to change |
| Attribution | Your programme alone caused it | A design with a comparison group |
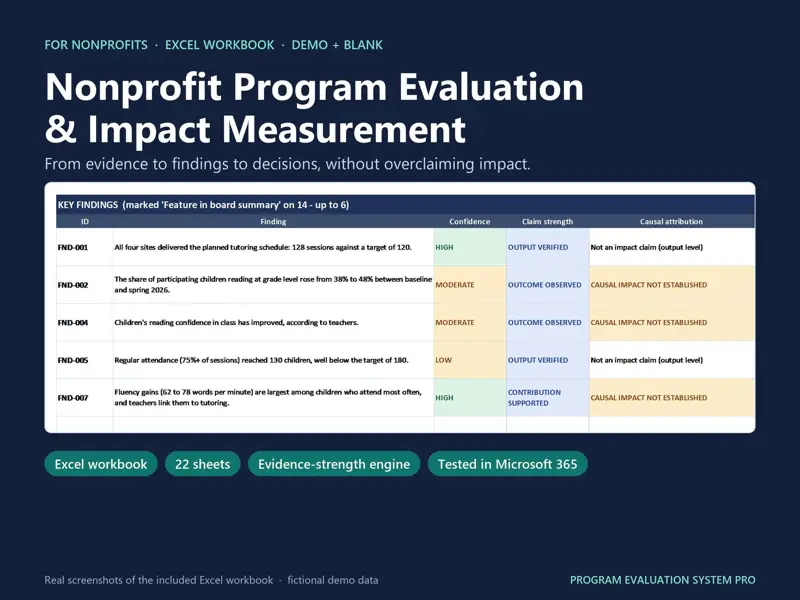
Most programme evaluations cannot reach the last row, and saying so protects you. In the demo file of the Program Evaluation System — a fictional reading programme — the share of children reading at grade level rises from 38% to 48%. The workbook labels that OUTCOME OBSERVED with CAUSAL IMPACT NOT ESTABLISHED beside it. The same demo reads READY WITH GAPS, with 10 of 12 readiness prerequisites met, 12 of 14 evidence items usable and 4 of 8 active indicators on track.
Three rules in that file are worth copying into any template. Unreviewed evidence never counts towards a finding. A serious data-quality issue caps confidence at LOW however strong the number looks. And contrary evidence blocks a HIGH confidence rating until somebody resolves it, rather than being left out of the report.
Let the report refuse to be ready
The most useful control in an M&E system is a report that can say no. If evidence is unverified or an indicator is on hold, the reporting sheet should show NOT READY with the reason, and the decision to publish anyway becomes a conscious act by a named person rather than an accident of a deadline.
The same applies to the learning half of MEAL, which is where templates are thinnest. A feedback register needs a real end status for every item — closed, overdue, referred — and an evaluation plan needs the management response recorded with owners and due dates, or the recommendations quietly expire. Judge a template on whether those have workflow states rather than free text.
Review by exception, every week
Reading a full indicator table weekly is a commitment nobody keeps past the second month. Reading only what breaks a rule takes fifteen minutes: indicators overdue for reporting, results awaiting evidence, open data-quality findings, anything off track, and any project nobody has updated.
The MEAL system builds that list as a Management Attention list ranking 14 items from P1 to P5 in its demo, each with the project, owner, date and a written reason. Ranking matters more than completeness here, because the point of the list is that it ends.
One adjacent boundary is worth knowing. Work planning and M&E are different systems and should stay that way: the Project Work Plan & WBS System links indicator IDs but deliberately does not track indicator data, keeping deliverables, acceptance and verified progress on its own side of the line. Templates that try to be both usually end up being neither.
Tools that help
- Monitoring & Evaluation (MEAL) System: shows an unreported indicator as NOT ASSESSED, puts a critical data-quality finding on DATA QUALITY HOLD, and marks a result evidence-ready only after verification.
- Logic Model & Logframe System: builds a logic model and a logframe from one set of records, scoring each indicator 0 to 100 for design completeness and flagging four critical blockers.
- Program Evaluation System: separates output verified, outcome observed and contribution supported, caps confidence on weak data, and blocks a HIGH rating while contrary evidence is open.
- Project Work Plan & WBS System: keeps planned, reported, verified and accepted progress apart, and links indicator IDs without pretending to track indicator data.
Where to start
Take the indicator list you already report on and, for each one, write the unit, the direction, and the numerator and denominator if it is a percentage. Expect a third of the list to fail that test on the first pass, and expect at least one indicator that two people have been calculating differently. Fixing those definitions costs a morning and changes every number downstream, which is why it comes before choosing any template at all.
Keep reading
All guidesNonprofit Operations: Board, Programs and Impact Systems
OperationsHow small nonprofits set up operations: file ownership, board quorum, volunteer readiness, program reviews, honest impact claims, risk, and purchase records.
GivingTuesday and Christmas Fundraising Plan for Small Nonprofits
FundraisingA backwards-planned GivingTuesday and Christmas appeal for small teams: timelines, one season map, proof checks for content, matching gifts and thank-yous.